The introduction of a digital speed camera has more than doubled the number of speeding tickets issued in Wellington's Ngauranga Gorge.
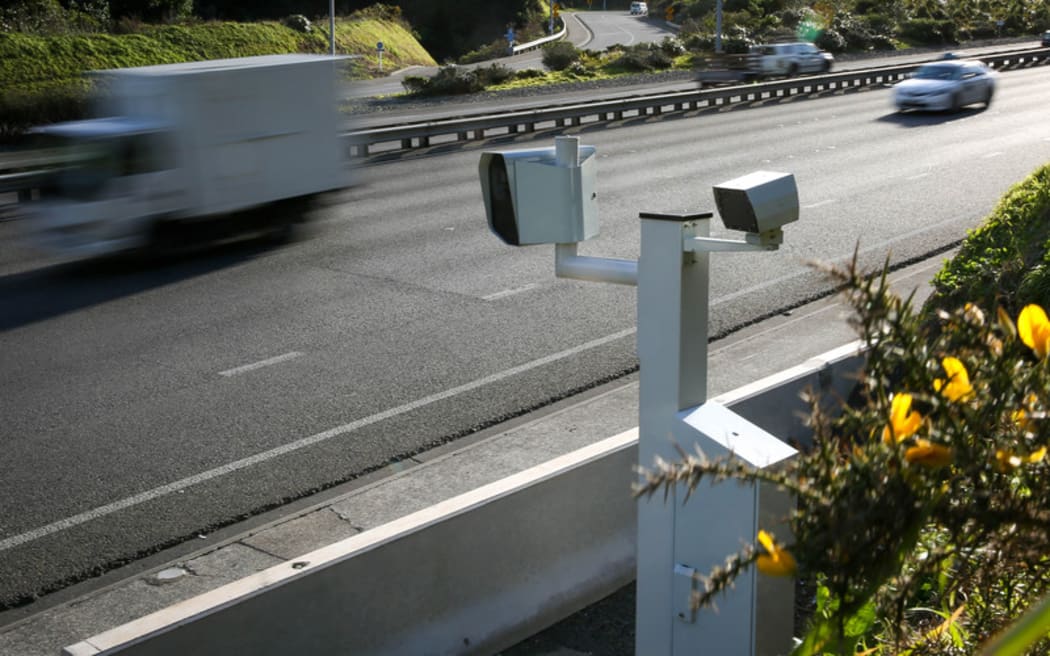
Digital speed camera at Ngauranga Gorge, Wellington. Photo: RNZ / Alexander Robertson
Figures obtained by Radio New Zealand under the Official Information Act show that in the first 10 months since the digital camera went live, around 21,000 speeding tickets have been issued to motorists.
That is more than double the number of offence notices issued over the same period between 2010 and 2011, when the old speed camera - a film camera which could take only a finite number of photos - was fully operational. In that period fewer than 10,000 tickets were issued.
Between July 2011 and May 2012 the static camera malfunctioned and only 389 tickets were issued in that period.
Since the new camera was installed motorists have been fined almost $1.5 million.
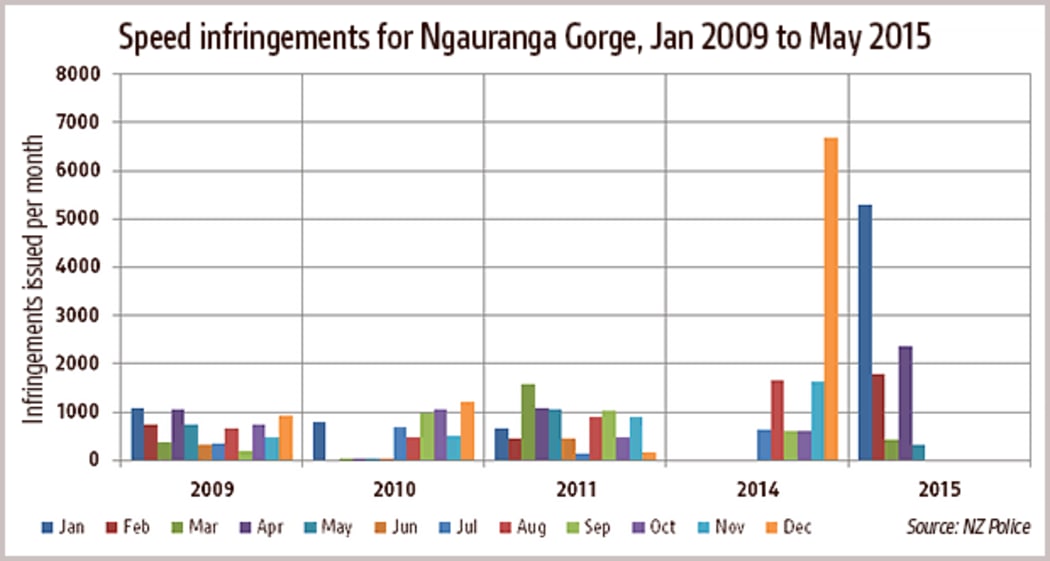
Graphic: RNZ
The new generation cameras use a dual radar system allowing them to monitor up to six lanes of traffic flowing in both directions.
By April next year there will be 56 throughout the country specifically in areas deemed to have a high risk of speed related crashes. Many are already in place, in areas such as Great South Road in Otahuhu, and on Great North Road at Kelston in Auckland.
Assistant commissioner for road policing Dave Cliff told Nine to Noon the old cameras had limited data storage and could only photograph a restricted number of vehicles.
"The new ones, because they burn the images onto a DVD, they can record a lot more, so there's a lot more capacity there," said Superindent Cliff.
"Better technology means that if people are exceeding speed limits this has a much better chance of detecting it."
Speed infringements for Ngauranga Gorge from January 2009 to May 2015. Source: Raw Data from New Zealand Police
| 2009 | 2010 | 2011 | 2012 | 2013 | 2014 | 2015 | |
|---|---|---|---|---|---|---|---|
| January | 1070 | 794 | 662 | 30 | 26 | 5288 | |
| February | 733 | 462 | 44 | 36 | 1798 | ||
| March | 383 | 23 | 1574 | 12 | 82 | 429 | |
| April | 1044 | 18 | 1076 | 118 | 38 | 2361 | |
| May | 735 | 25 | 1044 | 24 | 13 | 328 | |
| June | 308 | 9 | 457 | 21 | 28 | ||
| July | 349 | 689 | 138 | 55 | 5 | 641 | |
| August | 663 | 487 | 884 | 9 | 22 | 1655 | |
| September | 181 | 985 | 1040 | 3 | 620 | ||
| October | 737 | 1050 | 481 | 22 | 598 | ||
| November | 485 | 507 | 886 | 23 | 1633 | ||
| December | 927 | 1198 | 152 | 82 | 6689 |
|