Radiocarbon, grass and the ‘who farted’ problem are all part of a Carbon Watch NZ project measuring how much carbon dioxide is being produced by New Zealand’s cars and trucks.
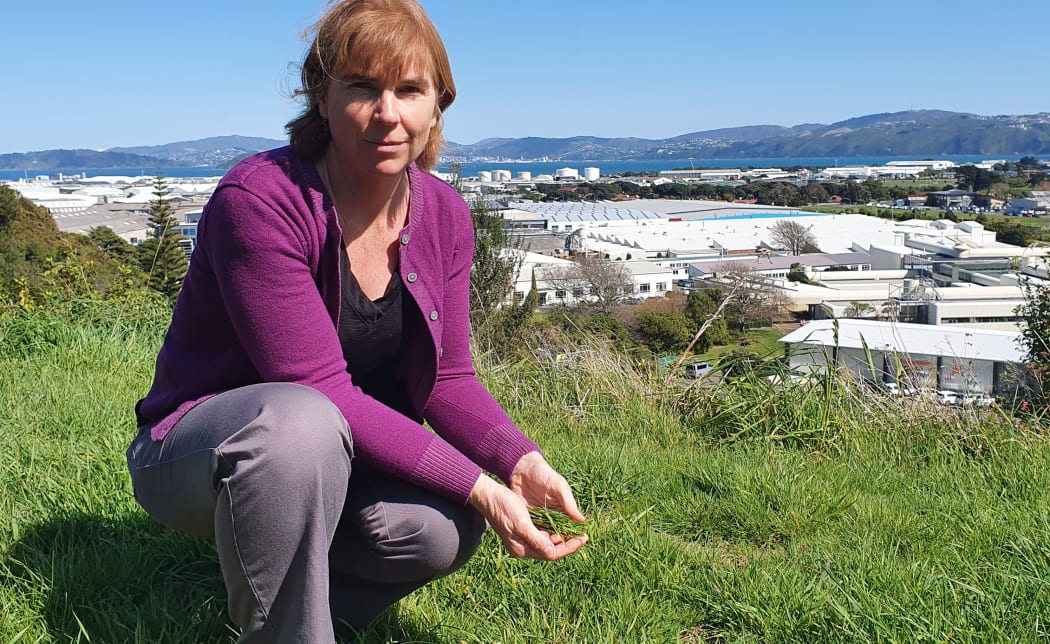
GNS Science radiocarbon scientist Jocelyn Turnbull is using grass to measure how much carbon dioxide is being emitted in New Zealand urban areas, such as Hutt City. Photo: RNZ / Alison Ballance
Find Our Changing World on Apple Podcasts, Spotify, Stitcher, iHeartRADIO, Google Podcasts, RadioPublic or wherever you listen to your podcasts
How to fingerprint how much CO2 is coming from burning fossil fuel
Measuring how much carbon dioxide is in the air is straightforward. Working out how much of that carbon dioxide has come from vehicles is rather more complicated.
“If we just measure carbon dioxide concentrations there’s not only emissions from fossil fuel burning, but there’s also this natural exchange,” says Jocelyn Turnbull, a radiocarbon scientist with GNS Science.
“Photosynthesis, where plants suck carbon dioxide out of the air to grow and respiration, where … plants breathe carbon dioxide back out into the atmosphere … So it can be hard to get at exactly how much carbon dioxide is coming from fossil fuel burning.”
The way Jocelyn and her colleagues get around this problem is to measure radiocarbon in carbon dioxide.
Because fossil fuel comes from petroleum reserves that are many millions of years old, all of the radiocarbons they contain have already radioactively decayed. As a result, carbon dioxide emissions released by the burning of fossil fuels decrease the relative amounts of radiocarbon in the atmosphere.
The radiocarbon team at GNS Science use this change in the ratio of heavy carbon isotopes to calculate how much carbon dioxide is being released due to the burning of fossil fuels.
The ‘who farted’ problem
The final step is to calculate where the emission occurred.
Jocelyn describes the process of identifying the source of carbon dioxide emissions as the ‘who farted problem’. Was it a small emission nearby, or a large emission from further away?
To work this out they combine the radiocarbon and carbon dioxide data with a weather model to work out where the emissions have come from.
“That’s the problem we’re trying to solve with these atmospheric transport models,” says Jocelyn. “Where did it come from? Who did it? How big was it?”
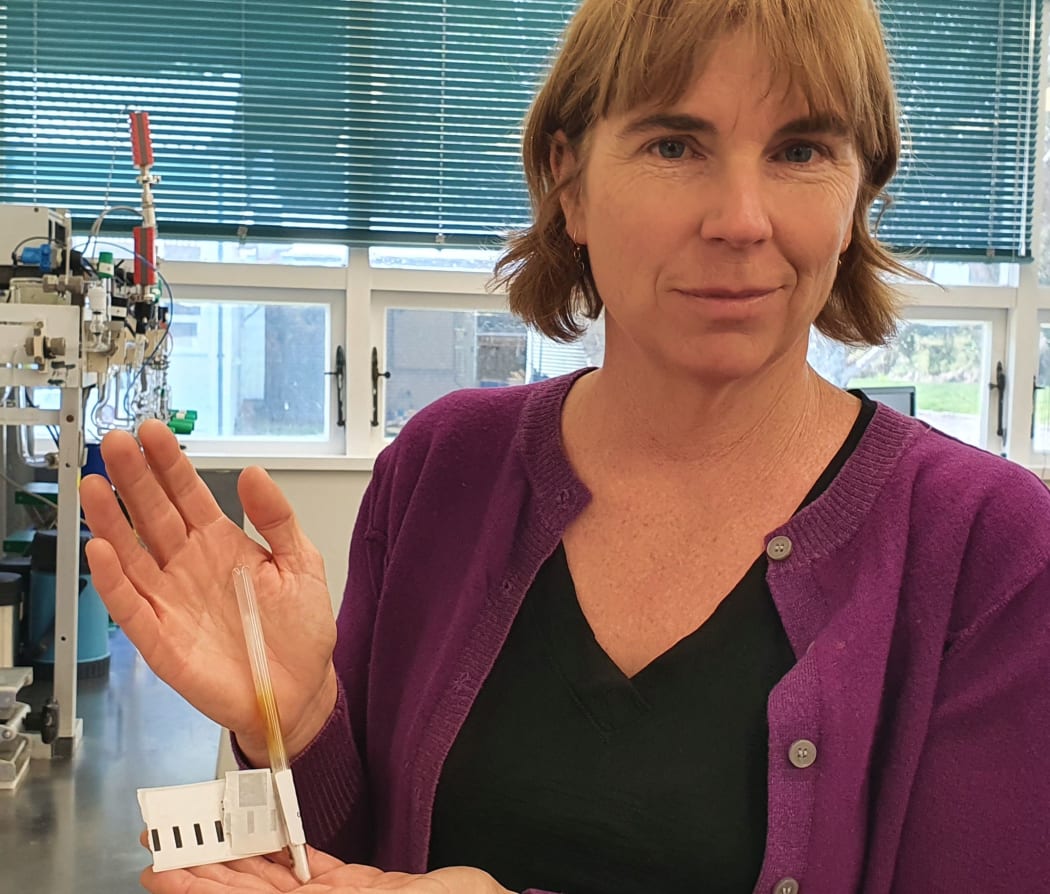
Jocelyn Turnbull holds a sample of grass which has been sealed in a quartz glass tube, ready for processing in the Rafter Radiocarbon Lab at GNS Science. Photo: RNZ / Alison Ballance
The grass record
Measuring a sample of air gives you a carbon dioxide level at a single moment in time, whereas plants turn out to be excellent record keepers over longer periods of time.
Jocelyn says that as plants suck carbon dioxide out of the air for photosynthesis, they keep a record of atmospheric radiocarbon levels at the time and place they are growing.
“They faithfully record the amount of radiocarbon that was in the atmospheric carbon dioxide … in their leaves and wood,” says Jocelyn.
Measuring carbon isotopes in grass is a complex process, carried out at the Rafter Radiocarbon Lab at GNS. Photo: RNZ / Alison Ballance
GNS Science maintains atmospheric measuring stations that continuously record radiocarbon and CO2 levels in busy urban locations.
But earlier in 2020, when New Zealand announced a Level 4 lockdown to stop the spread of covid-19, Jocelyn and her team realised they had an unprecedented opportunity to accurately measure background radiocarbon and CO2 levels in the absence of city traffic.
The problem was, that with only two day’s notice, they had no time to deploy their sophisticated equipment.
Instead, they put out a call to citizen scientists to collect grass samples from where they lived.
“We got about 400 people collecting samples for us around the country,” says Jocelyn.
People were asked to collect weekly samples during lockdown, and the result was over 1000 grass samples safely frozen and delivered to GNS.
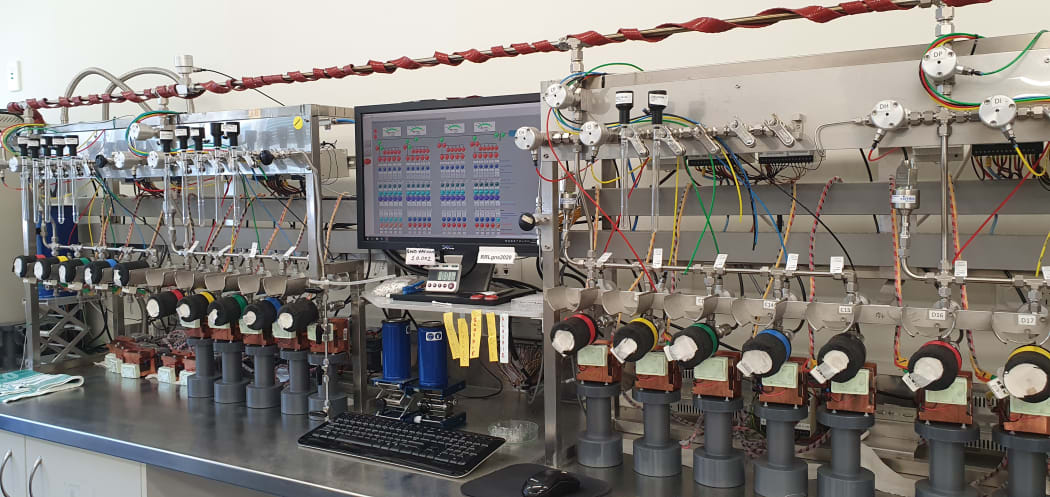
It is time-consuming and complicated to process the samples, and some are still in process of being analysed in the Rafter Radiocarbon Laboratory in the Hutt Valley.
The process involves heating, freezing, the production of dry ice and graphite, and eventually a tiny sample is put in a particle accelerator attached to a mass spectrometer.
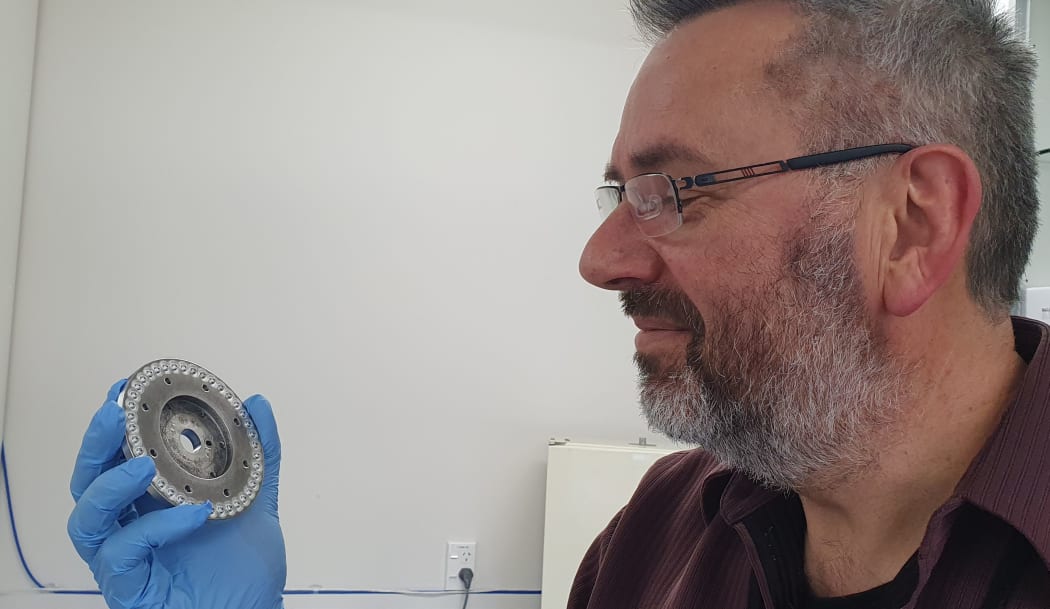
Radiocarbon scientist Albert Zondervan, from GNS Science, holds a wheel containing 40 grass samples ready for analysis in a particle accelerator attached to a mass spectrometer. Photo: RNZ / Alison Ballance
Jocelyn says that they measured a dramatic decrease in carbon dioxide emissions at four busy inner city sites in Wellington and Lower Hutt during level 4 lockdown.
“The fossil fuel CO2 is about 80 percent lower during level 4 than during level 1. And that’s what we might expect because those sites are really driven by local traffic.”
This work is part of the wider Carbon Watch NZ project. Listen to the full podcast to hear Jocelyn explain the radiocarbon testing process in more detail and hear how work using wood samples from trees is providing insights into the role of the Southern Ocean in the carbon cycle.
Last week we featured NIWA atmospheric scientists talking about Carbon Watch & 50 years of CO2 measurements in NZ.